Multiple Choice
Figure 52.9 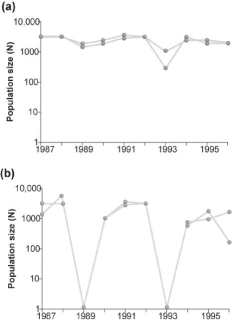
-Assuming graph (b) in Figure 52.8 is the result of some experimental treatment,what can be concluded?
A) The experimental treatment exacerbated the population cycling.
B) The experimental treatment did not affect population cycling in this species.
C) The experimental treatment has most likely identified the cause of population cycling.
D) None of the above answers applies.
Correct Answer:

Verified
Correct Answer:
Verified
Q12: Figure 52.12 <img src="https://d2lvgg3v3hfg70.cloudfront.net/TB3733/.jpg" alt="Figure 52.12
Q13: Figure 52.14 <img src="https://d2lvgg3v3hfg70.cloudfront.net/TB3733/.jpg" alt="Figure 52.14
Q15: Figure 52.15 <img src="https://d2lvgg3v3hfg70.cloudfront.net/TB3733/.jpg" alt="Figure 52.15
Q15: Use the following abstract from Theoretical Population
Q16: Figure 52.3 <img src="https://d2lvgg3v3hfg70.cloudfront.net/TB3733/.jpg" alt="Figure 52.3
Q18: Figure 52.2 <img src="https://d2lvgg3v3hfg70.cloudfront.net/TB3733/.jpg" alt="Figure 52.2
Q24: <span class="ql-formula" data-value="\text {Life Table for Lacerta
Q24: If 40 individuals were alive in 1921
Q31: <img src="https://d2lvgg3v3hfg70.cloudfront.net/TB6548/.jpg" alt="
Q38: A model that estimates the likelihood that