Multiple Choice
Figure 52.15 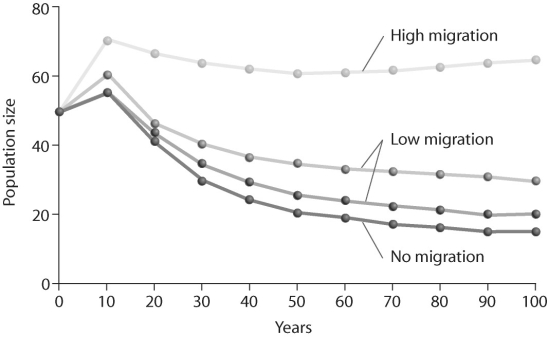
-Looking at the figure above,what is contributing significantly to stabilizing population size over time?
A) no migration
B) low migration
C) high migration
D) none of the above
Correct Answer:

Verified
Correct Answer:
Verified
Q10: Which of these terms defines how the
Q12: Figure 52.12 <img src="https://d2lvgg3v3hfg70.cloudfront.net/TB3733/.jpg" alt="Figure 52.12
Q13: Figure 52.14 <img src="https://d2lvgg3v3hfg70.cloudfront.net/TB3733/.jpg" alt="Figure 52.14
Q16: Figure 52.3 <img src="https://d2lvgg3v3hfg70.cloudfront.net/TB3733/.jpg" alt="Figure 52.3
Q17: During the Lacerta vivipara lizard study,researchers monitored
Q17: Figure 52.9 <img src="https://d2lvgg3v3hfg70.cloudfront.net/TB3733/.jpg" alt="Figure 52.9
Q18: Figure 52.2 <img src="https://d2lvgg3v3hfg70.cloudfront.net/TB3733/.jpg" alt="Figure 52.2
Q24: <span class="ql-formula" data-value="\text {Life Table for Lacerta
Q31: <img src="https://d2lvgg3v3hfg70.cloudfront.net/TB6548/.jpg" alt="
Q38: A model that estimates the likelihood that