Multiple Choice
Figure 52.14 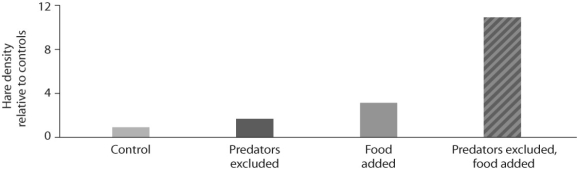
-Looking at the data in the figure above from the hare/lynx experiment,what conclusion can you draw?
A) Hares control lynx population size.
B) Lynx control hare population size.
C) Lynx and hare populations are independent of each other.
D) Hare populations are limited by both predation and food availability.
Correct Answer:

Verified
Correct Answer:
Verified
Q8: Figure 52.7 <img src="https://d2lvgg3v3hfg70.cloudfront.net/TB3733/.jpg" alt="Figure 52.7
Q10: Which of these terms defines how the
Q12: Figure 52.12 <img src="https://d2lvgg3v3hfg70.cloudfront.net/TB3733/.jpg" alt="Figure 52.12
Q13: Use the following abstract from Theoretical Population
Q15: Figure 52.15 <img src="https://d2lvgg3v3hfg70.cloudfront.net/TB3733/.jpg" alt="Figure 52.15
Q16: Figure 52.3 <img src="https://d2lvgg3v3hfg70.cloudfront.net/TB3733/.jpg" alt="Figure 52.3
Q17: During the Lacerta vivipara lizard study,researchers monitored
Q17: Figure 52.9 <img src="https://d2lvgg3v3hfg70.cloudfront.net/TB3733/.jpg" alt="Figure 52.9
Q18: Figure 52.2 <img src="https://d2lvgg3v3hfg70.cloudfront.net/TB3733/.jpg" alt="Figure 52.2
Q24: <span class="ql-formula" data-value="\text {Life Table for Lacerta