Essay
The following histogram displays the magnitudes of the 614 earthquakes with Richter scale magnitude greater than 1.0 that occurred in the United States between March 25 and April 1, 2004: 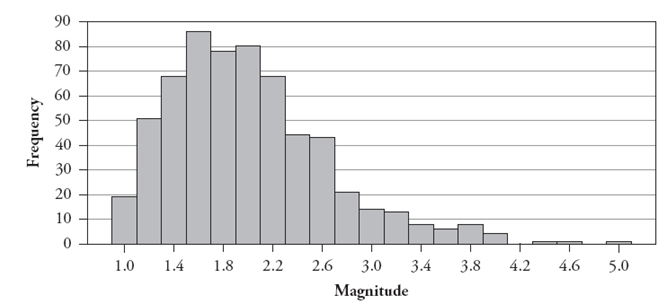
-Which histogram do you think displays the variable price paid for most recent haircut? Justify your answer.
Correct Answer:

Verified
Histogram c displays the variable price ...View Answer
Unlock this answer now
Get Access to more Verified Answers free of charge
Correct Answer:
Verified
View Answer
Unlock this answer now
Get Access to more Verified Answers free of charge
Q29: The following table reports counts of the
Q30: The following histograms display the distributions
Q31: The following dotplot displays the salaries
Q32: The following data are monthly rents
Q33: The following side-by-side stemplot displays the total
Q35: The following data are monthly rents
Q36: The following table reports counts of the
Q37: Suppose a company that has recently fired
Q38: The following data are monthly rents
Q39: An instructor conducted an in-class experiment where