Essay
The following histograms display the distributions of percentage of a state's residents who are Mexican, for each region of the country (West, South, Northeast, Midwest). 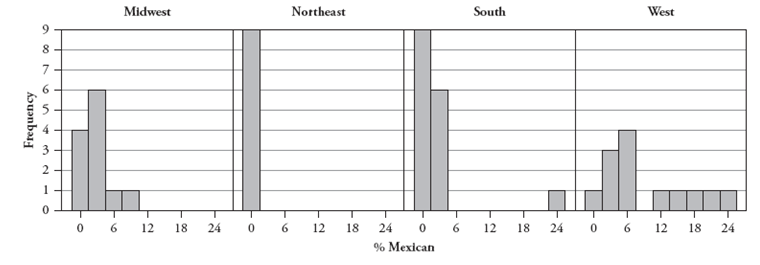
-Which of the following sets of five numbers has the smallest standard deviation? Explain your reasoning, but do not do any calculations.
(a)
(b)
(c)
Correct Answer:

Verified
Set (b) has the smallest stand...View Answer
Unlock this answer now
Get Access to more Verified Answers free of charge
Correct Answer:
Verified
View Answer
Unlock this answer now
Get Access to more Verified Answers free of charge
Q25: The 2001_2002 National Health and Nutrition Examination
Q26: The following histograms display the distributions of
Q27: a. Construct a hypothetical example of ten
Q28: Is it better to praise a child's
Q29: The following table reports counts of the
Q31: The following dotplot displays the salaries
Q32: The following data are monthly rents
Q33: The following side-by-side stemplot displays the total
Q34: The following histogram displays the magnitudes of
Q35: The following data are monthly rents