Short Answer
The following dotplot displays the salaries of the 23 presidents of California State University campuses for the 2007\_08 academic year:
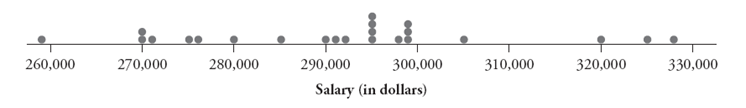 These salaries, arranged in order, are listed here:
a. Determine the five-number summary of these salaries. Consider the following computer output:
b. The salary for Cal Poly's President Baker is . Calculate the -score for his salary, and decide whether his salary is more than two standard deviations above the mean.
c. Check whether President Baker's salary is an outlier, according to the 1.5 _ IQR rule.
Correct Answer:

Verified
a. Minimum:  Maximum:
, so the median i...View Answer
Unlock this answer now
Get Access to more Verified Answers free of charge
Correct Answer:
Verified
View Answer
Unlock this answer now
Get Access to more Verified Answers free of charge
Q26: The following histograms display the distributions of
Q27: a. Construct a hypothetical example of ten
Q28: Is it better to praise a child's
Q29: The following table reports counts of the
Q30: The following histograms display the distributions
Q32: The following data are monthly rents
Q33: The following side-by-side stemplot displays the total
Q34: The following histogram displays the magnitudes of
Q35: The following data are monthly rents
Q36: The following table reports counts of the