Short Answer
The following table reports counts of the number of "close friends" reported by a sample of men and a sample of women: 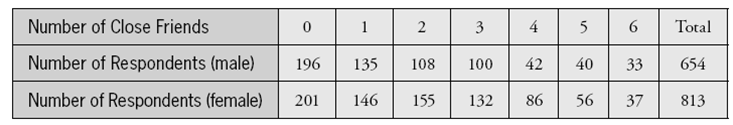
-Based on the shape of the distributions, do you expect the means to be greater than the medians, less than the medians, or very close to the medians? (Do not calculate either mean.)
Correct Answer:

Verified
Because these distri...View Answer
Unlock this answer now
Get Access to more Verified Answers free of charge
Correct Answer:
Verified
View Answer
Unlock this answer now
Get Access to more Verified Answers free of charge
Q24: The following histograms display the distributions of
Q25: The 2001_2002 National Health and Nutrition Examination
Q26: The following histograms display the distributions of
Q27: a. Construct a hypothetical example of ten
Q28: Is it better to praise a child's
Q30: The following histograms display the distributions
Q31: The following dotplot displays the salaries
Q32: The following data are monthly rents
Q33: The following side-by-side stemplot displays the total
Q34: The following histogram displays the magnitudes of