Multiple Choice
Figure 52.1 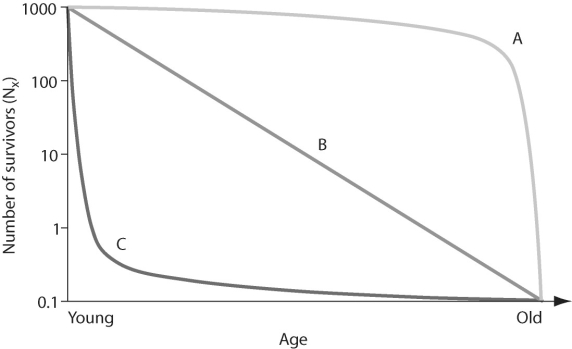
-In Figure 52.1,which of the following survivorship curves most applies to humans living in developed countries?
A) curve A
B) curve B
C) curve C
D) curve A or curve B
E) none of the above
Correct Answer:

Verified
Correct Answer:
Verified
Q5: It is estimated that a flock of
Q29: Figure 52.7 <img src="https://d2lvgg3v3hfg70.cloudfront.net/TB3734/.jpg" alt="Figure 52.7
Q30: Figure 52.5 <img src="https://d2lvgg3v3hfg70.cloudfront.net/TB3734/.jpg" alt="Figure 52.5
Q31: Projections for Earth's human population by 2050
Q32: Figure 52.2 <img src="https://d2lvgg3v3hfg70.cloudfront.net/TB3734/.jpg" alt="Figure 52.2
Q33: Figure 52.11 <img src="https://d2lvgg3v3hfg70.cloudfront.net/TB3734/.jpg" alt="Figure 52.11
Q35: Figure 52.6 <img src="https://d2lvgg3v3hfg70.cloudfront.net/TB3734/.jpg" alt="Figure 52.6
Q37: Figure 52.7 <img src="https://d2lvgg3v3hfg70.cloudfront.net/TB3734/.jpg" alt="Figure 52.7
Q38: A model that estimates the likelihood that
Q39: Suppose researchers marked 800 turtles and later