Multiple Choice
Figure 52.6 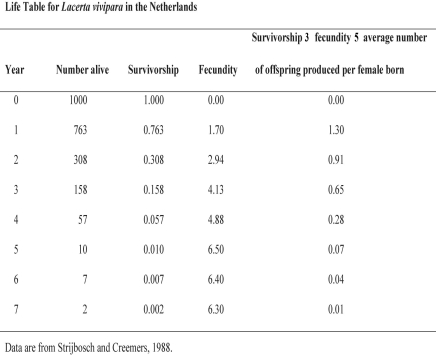
-Using Figure 52.6,determine which age class year would hurt the population growth most if it were wiped out by disease.
A) age class year 1
B) age class year 2
C) age class year 3
D) age class year 4
E) age class year 5
Correct Answer:

Verified
Correct Answer:
Verified
Q5: It is estimated that a flock of
Q30: Figure 52.5 <img src="https://d2lvgg3v3hfg70.cloudfront.net/TB3734/.jpg" alt="Figure 52.5
Q31: Projections for Earth's human population by 2050
Q32: Figure 52.2 <img src="https://d2lvgg3v3hfg70.cloudfront.net/TB3734/.jpg" alt="Figure 52.2
Q33: Figure 52.11 <img src="https://d2lvgg3v3hfg70.cloudfront.net/TB3734/.jpg" alt="Figure 52.11
Q34: Figure 52.1 <img src="https://d2lvgg3v3hfg70.cloudfront.net/TB3734/.jpg" alt="Figure 52.1
Q37: Figure 52.7 <img src="https://d2lvgg3v3hfg70.cloudfront.net/TB3734/.jpg" alt="Figure 52.7
Q38: A model that estimates the likelihood that
Q39: Suppose researchers marked 800 turtles and later
Q40: Figure 52.9 <img src="https://d2lvgg3v3hfg70.cloudfront.net/TB3734/.jpg" alt="Figure 52.9