Multiple Choice
Figure 52.7 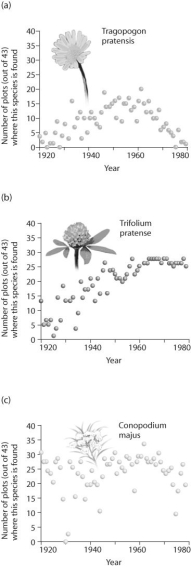
-Based on the graphs from the Park Grass study in Rothamsted,UK (Figure 52.7) ,which species was most likely controlled by density-independent factors?
A) Tragopogon pratensis
B) Trifolium pratense
C) Conopodium majus
D) It does not appear that any of the species are under density-independent control and instead are mainly regulated by density-dependent factors.
E) All of the species appear to be controlled by density-independent factors.
Correct Answer:

Verified
Correct Answer:
Verified
Q24: If 40 individuals were alive in 1921
Q25: Figure 52.3 <img src="https://d2lvgg3v3hfg70.cloudfront.net/TB3734/.jpg" alt="Figure 52.3
Q26: Figure 52.10 <img src="https://d2lvgg3v3hfg70.cloudfront.net/TB3734/.jpg" alt="Figure 52.10
Q27: Figure 52.3 <img src="https://d2lvgg3v3hfg70.cloudfront.net/TB3734/.jpg" alt="Figure 52.3
Q28: Figure 52.6 <img src="https://d2lvgg3v3hfg70.cloudfront.net/TB3734/.jpg" alt="Figure 52.6
Q30: Figure 52.5 <img src="https://d2lvgg3v3hfg70.cloudfront.net/TB3734/.jpg" alt="Figure 52.5
Q31: Projections for Earth's human population by 2050
Q32: Figure 52.2 <img src="https://d2lvgg3v3hfg70.cloudfront.net/TB3734/.jpg" alt="Figure 52.2
Q33: Figure 52.11 <img src="https://d2lvgg3v3hfg70.cloudfront.net/TB3734/.jpg" alt="Figure 52.11
Q34: Figure 52.1 <img src="https://d2lvgg3v3hfg70.cloudfront.net/TB3734/.jpg" alt="Figure 52.1