Multiple Choice
Figure 52.2 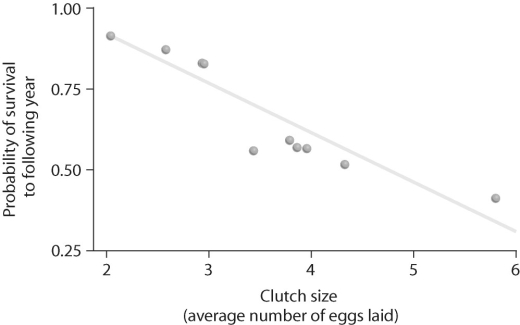
-Looking at the data in Figure 52.2,what can be said about survival and clutch size?
A) Animals with low survival tend to have low clutch sizes.
B) High clutch sizes tend to produce animals with low survival.
C) Animals with high fecundity tend to live longer.
D) Animals with high fecundity tend not to live as long as animals with low fecundity.
Correct Answer:

Verified
Correct Answer:
Verified
Q5: It is estimated that a flock of
Q27: Figure 52.3 <img src="https://d2lvgg3v3hfg70.cloudfront.net/TB3734/.jpg" alt="Figure 52.3
Q28: Figure 52.6 <img src="https://d2lvgg3v3hfg70.cloudfront.net/TB3734/.jpg" alt="Figure 52.6
Q29: Figure 52.7 <img src="https://d2lvgg3v3hfg70.cloudfront.net/TB3734/.jpg" alt="Figure 52.7
Q30: Figure 52.5 <img src="https://d2lvgg3v3hfg70.cloudfront.net/TB3734/.jpg" alt="Figure 52.5
Q31: Projections for Earth's human population by 2050
Q33: Figure 52.11 <img src="https://d2lvgg3v3hfg70.cloudfront.net/TB3734/.jpg" alt="Figure 52.11
Q34: Figure 52.1 <img src="https://d2lvgg3v3hfg70.cloudfront.net/TB3734/.jpg" alt="Figure 52.1
Q35: Figure 52.6 <img src="https://d2lvgg3v3hfg70.cloudfront.net/TB3734/.jpg" alt="Figure 52.6
Q37: Figure 52.7 <img src="https://d2lvgg3v3hfg70.cloudfront.net/TB3734/.jpg" alt="Figure 52.7