Multiple Choice
The figure given below shows the revenue and cost curves of a monopolistically competitive firm. Figure: 11.3 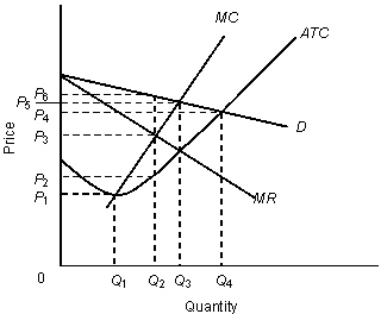 In the figure,
D: Demand curve
MR: Marginal revenue curve
MC: Marginal cost curve
ATC: Average total cost curve
-Refer to Figure 11.3.A perfectly competitive outcome would exist at a price of _____ and an output level of _____.
A) P6; Q2
B) P4; Q4
C) P3; Q2
D) P1; Q1
E) P5; Q3
Correct Answer:

Verified
Correct Answer:
Verified
Q19: The figure below shows the revenue and
Q23: The table below shows the payoff (profit)
Q27: The table below shows the payoff (profit)
Q47: The table below shows the payoff (profit)
Q50: Suppose a monopolistically competitive firm is producing
Q51: Which of the following statements about collusion
Q52: The following table shows the payoff matrix
Q57: The figure given below shows the revenue
Q59: Product differentiation:<br>A)is carried out by perfectly competitive
Q72: The figure given below shows the cost