Multiple Choice
The figure given below shows the revenue and cost curves of a monopolistically competitive firm. Figure 11.4 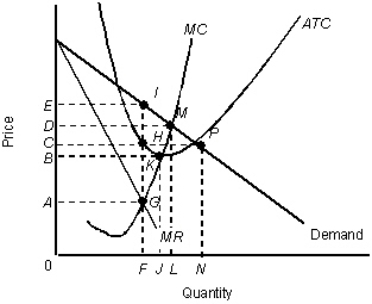
MR: Marginal revenue curve
ATC: Average total cost curve
MC: Marginal cost curve
-Assume that the firm in Figure 11.4 is monopolistically competitive.In the long run,we would expect:
A) the price of the firm's output to increase.
B) entry of new firms because economic profits are positive.
C) exit of few existing firms because economic profits are negative.
D) the firm's demand curve to shift outward.
E) the firm's demand curve to becomes less elastic.
Correct Answer:

Verified
Correct Answer:
Verified
Q5: The table below shows the payoff (profit)
Q19: The figure below shows the revenue and
Q23: The table below shows the payoff (profit)
Q27: The table below shows the payoff (profit)
Q47: The table below shows the payoff (profit)
Q59: Product differentiation:<br>A)is carried out by perfectly competitive
Q62: The table below shows the payoff (profit)
Q62: The following table shows the payoff matrix
Q65: The market structure called monopolistic competition is
Q80: The table below shows the payoff (profit)