Multiple Choice
The following figure shows the revenue curves of a monopolist: Figure 10.6 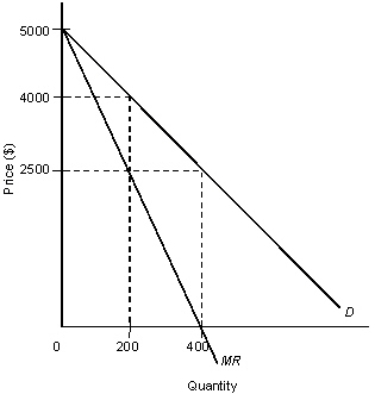
D: Average revenue
MR: Marginal revenue
-Refer to Figure 10.6.Assume that marginal costs are constant at $2,500 and fixed costs are zero.Under a monopoly,consumer surplus would be:
A) $100,000.
B) $500,000.
C) $300,000.
D) $250,000.
E) $200,000.
Correct Answer:

Verified
Correct Answer:
Verified
Q1: The figure given below shows the cost
Q51: Movie theaters are able to offer discounts
Q52: The following figure shows revenue and cost
Q54: When Glaxo-Wellcome introduced AZT,an AIDS drug,it was
Q57: The following figure shows the revenue and
Q59: The following table shows the units of
Q72: The figure given below shows the aggregate
Q84: The figure given below shows the cost
Q88: The figure given below shows the cost
Q115: The figure given below shows the cost