Multiple Choice
The following figure shows revenue and cost curves of a monopolist. Figure 10.8 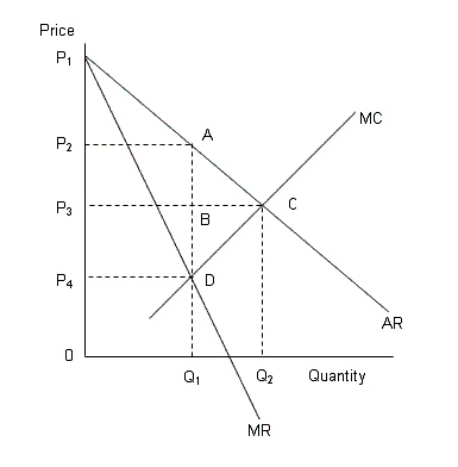
AR: Average revenue curve
MR: Marginal revenue curve
MC: Marginal cost curve
-According to Figure 10.8,the profit maximizing price of the monopolist is:
A) 0.
B) P4.
C) P3.
D) P2.
E) P1.
Correct Answer:

Verified
Correct Answer:
Verified
Q48: Before World War II,Alcoa controlled the supply
Q49: The figures given below represent the revenue
Q50: Which of the following would least likely
Q51: Movie theaters are able to offer discounts
Q54: When Glaxo-Wellcome introduced AZT,an AIDS drug,it was
Q56: The following figure shows the revenue curves
Q57: The following figure shows the revenue and
Q72: The figure given below shows the aggregate
Q88: The figure given below shows the cost
Q92: The figure given below shows the aggregate