Multiple Choice
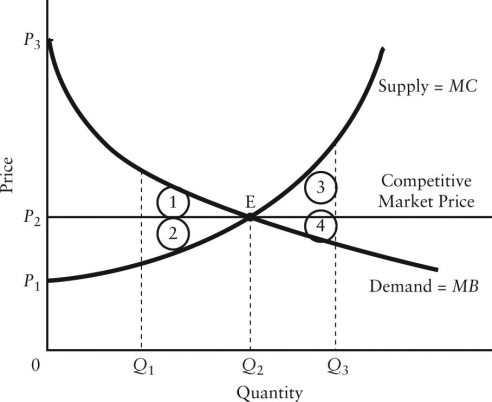
The diagram below shows the demand and supply curves in a perfectly competitive market.  FIGURE 12-5
-Refer to Figure 12-5.Allocative efficiency occurs
A) at output level Q3.
B) at output level Q1.
C) at price P1 and output Q3.
D) at price P2 and output Q2.
E) where the areas 1,2,3,and 4 are maximized.
Correct Answer:

Verified
Correct Answer:
Verified
Q26: Consider a natural monopoly that has declining
Q27: The diagram below shows the demand and
Q28: <img src="https://d2lvgg3v3hfg70.cloudfront.net/TB5441/.jpg" alt=" FIGURE 12-3 -Refer
Q29: The diagram below shows the market demand
Q30: If average-cost pricing is imposed on a
Q32: The diagram below shows the demand and
Q33: Consider the following information for a regional
Q34: Consider the following information for a regional
Q35: In general,the sum of consumer and producer
Q36: In principle,a comparison of the long-run equilibrium