Solved
FIGURE 12-3 -Refer to Figure 12-3.The Area Representing Producer Surplus at the at the Monopoly
Multiple Choice
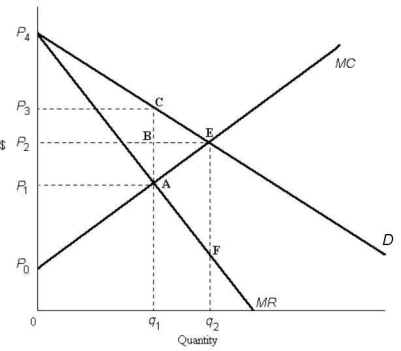 FIGURE 12-3
-Refer to Figure 12-3.The area representing producer surplus at the monopoly equilibrium is outlined by
A) 0P0Aq1.
B) P0P2BA.
C) P0AP1.
D) P0P3CA.
E) 0P3Cq1.
Correct Answer:

Verified
Correct Answer:
Verified
Related Questions
Q23: There has been a trend toward less
Q24: The Canadian economy is achieving allocative efficiency
Q25: The diagram below shows cost and revenue
Q26: Consider a natural monopoly that has declining
Q27: The diagram below shows the demand and
Q29: The diagram below shows the market demand
Q30: If average-cost pricing is imposed on a
Q31: The diagram below shows the demand and
Q32: The diagram below shows the demand and
Q33: Consider the following information for a regional