Multiple Choice
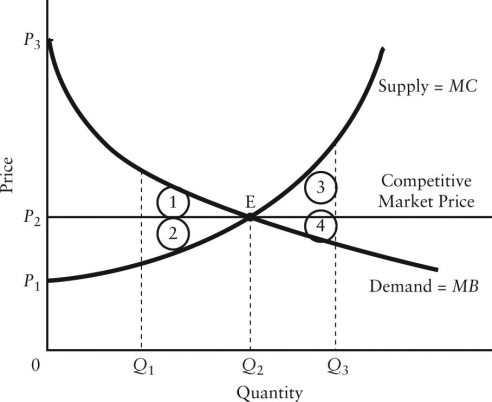
The diagram below shows the demand and supply curves in a perfectly competitive market.  FIGURE 12-5
-Refer to Figure 12-5.If output in this market were Q3,and the price were still P2,the loss in consumer surplus relative to the competitive equilibrium would be illustrated by area
A) 1.
B) 2.
C) 3.
D) 4.
E) 3 + 4.
Correct Answer:

Verified
Correct Answer:
Verified
Q22: Consider three firms,A,B and C,all producing kilos
Q23: There has been a trend toward less
Q24: The Canadian economy is achieving allocative efficiency
Q25: The diagram below shows cost and revenue
Q26: Consider a natural monopoly that has declining
Q28: <img src="https://d2lvgg3v3hfg70.cloudfront.net/TB5441/.jpg" alt=" FIGURE 12-3 -Refer
Q29: The diagram below shows the market demand
Q30: If average-cost pricing is imposed on a
Q31: The diagram below shows the demand and
Q32: The diagram below shows the demand and