Multiple Choice
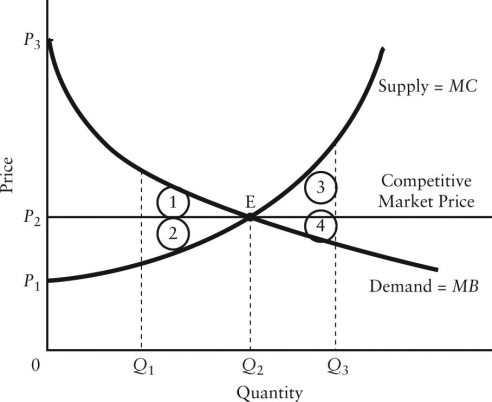
The diagram below shows the demand and supply curves in a perfectly competitive market.  FIGURE 12-5
-Refer to Figure 12-5.At the free-market equilibrium,consumer surplus is represented by the area
A) P2P3E.
B) P1P2E.
C) P1P3E.
D) 1 + 2.
E) 1 + 2 + 3 + 4.
Correct Answer:

Verified
Correct Answer:
Verified
Q27: The diagram below shows the demand and
Q28: <img src="https://d2lvgg3v3hfg70.cloudfront.net/TB5441/.jpg" alt=" FIGURE 12-3 -Refer
Q29: The diagram below shows the market demand
Q30: If average-cost pricing is imposed on a
Q31: The diagram below shows the demand and
Q33: Consider the following information for a regional
Q34: Consider the following information for a regional
Q35: In general,the sum of consumer and producer
Q36: In principle,a comparison of the long-run equilibrium
Q37: Suppose we compare two monopolists with identical