Multiple Choice
The table below shows the total production for varying numbers of hours worked producing yo-yos.The firm sells its product and hires its workers in competitive markets.
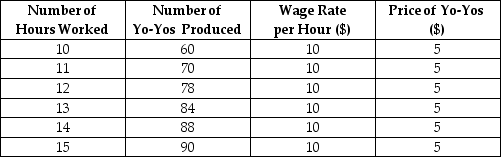 TABLE 13-4
-Refer to Table 13-4.How many worker-hours should this profit-maximizing firm hire?
A) 11
B) 12
C) 13
D) 14
E) 15
Correct Answer:

Verified
Correct Answer:
Verified
Q76: The demand and supply curves shown below
Q77: The diagram below shows the MRP curve
Q78: Assume that the market for farmland in
Q79: For any firm in any market structure,a
Q80: The three diagrams below each show a
Q82: Consider the following production and cost schedule
Q83: The diagram below shows the MRP curve
Q84: Other things being equal,if it becomes more
Q85: Which of the following concepts is most
Q86: The difference between temporary factor-price differentials and