Multiple Choice
The diagram below shows the MRP curve for a firm producing copper plumbing pipe.The factor of production being considered here is hours of labour. 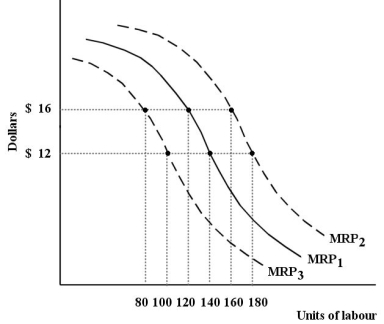 FIGURE 13-1
-Refer to Figure 13-1.Suppose this profit-maximizing firm is facing MRP1 and a wage rate of $12 per hour.Now suppose there is,simultaneously,an increase in demand for copper plumbing pipe (such that MRP shifts to MRP2) ,and an increase in the wage rate to $16 per hour.The firm should
A) employ 20 more units of labour.
B) employ 40 more units of labour.
C) employ the same number of units of labour.
D) employ 40 fewer units of labour
E) employ 20 fewer units of labour.
Correct Answer:

Verified
Correct Answer:
Verified
Q72: Consider the following production and cost schedule
Q73: A demand for a factor of production
Q74: The aggregate quantity of labour supplied will
Q75: Consider the following demand and supply curves
Q76: The demand and supply curves shown below
Q78: Assume that the market for farmland in
Q79: For any firm in any market structure,a
Q80: The three diagrams below each show a
Q81: The table below shows the total production
Q82: Consider the following production and cost schedule