Multiple Choice
The demand and supply curves shown below apply to a competitive market for a factor used in the production of widgets. 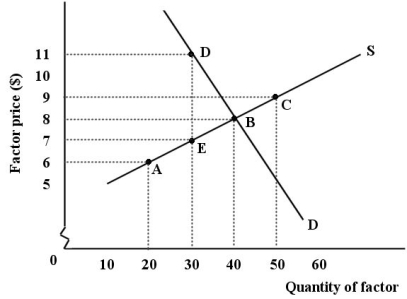 FIGURE 13-2
-Refer to Figure 13-2.If the supply and demand curves for the factor are as shown in the diagram,but the wage being paid is $9,and the market is at point C,
A) the wage is higher than the factor's marginal revenue product,and firms will reduce the amount of the factor employed.
B) the wage is higher than the factor's marginal product,and firms will reduce the amount of the factor employed.
C) the marginal revenue product is not equal to the marginal cost of the factor and firms will increase the amount of the factor employed.
D) the demand curve will shift to the right until equilibrium factor price and quantity are re-established.
E) the demand curve will shift to the left until equilibrium factor price and quantity are re-established.
Correct Answer:

Verified
Correct Answer:
Verified
Q71: Consider the following production and cost schedule
Q72: Consider the following production and cost schedule
Q73: A demand for a factor of production
Q74: The aggregate quantity of labour supplied will
Q75: Consider the following demand and supply curves
Q77: The diagram below shows the MRP curve
Q78: Assume that the market for farmland in
Q79: For any firm in any market structure,a
Q80: The three diagrams below each show a
Q81: The table below shows the total production