Multiple Choice
The three diagrams below each show a supply curve for oil tankers over a relatively short period of time. 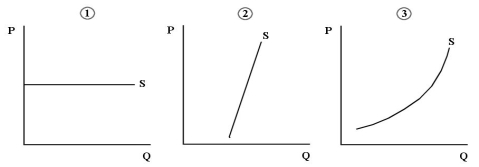 FIGURE 13-3
-Refer to Figure 13-3.Consider the supply of oil tankers to an individual Canadian shipping firm,the North American shipping industry,and the world shipping industry.Which diagram best shows the supply of oil tankers that is relevant to the world shipping industry?
A) diagram 1
B) diagram 2
C) diagram 3
D) diagrams 2 or 3
E) diagrams 1 or 2
Correct Answer:

Verified
Correct Answer:
Verified
Q75: Consider the following demand and supply curves
Q76: The demand and supply curves shown below
Q77: The diagram below shows the MRP curve
Q78: Assume that the market for farmland in
Q79: For any firm in any market structure,a
Q81: The table below shows the total production
Q82: Consider the following production and cost schedule
Q83: The diagram below shows the MRP curve
Q84: Other things being equal,if it becomes more
Q85: Which of the following concepts is most