Multiple Choice
The following figure shows the effect of a price ceiling in the market for yams.The market was initially in equilibrium at price P2 and quantity B.
Figure 10-1 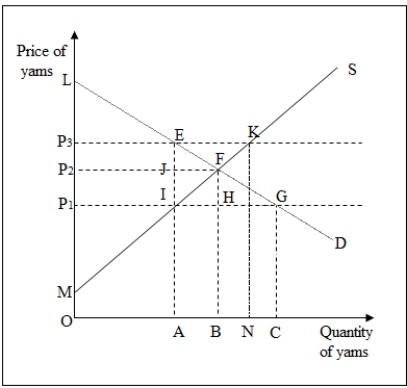
-In Figure 10-1,the aggregate producer surplus at the initial point of equilibrium,F,is area _____.
A) P2FIP1
B) FP2M
C) MIP1
D) LP2F
Correct Answer:

Verified
Correct Answer:
Verified
Q17: In 2002,the U.S.imposed higher tariffs on steel
Q30: When the efficient rate of output is
Q37: The total surplus gained by all the
Q38: Deregulation of the airline industry has resulted
Q46: The following figure shows the intersection of
Q48: The following figure shows the intersection of
Q50: The following figure shows the demand and
Q52: Which of the following correctly identifies the
Q53: The following figure shows the intersection of
Q54: The following figure shows the intersection of