Multiple Choice
The following figure shows the demand and supply for a commodity in the domestic U.S.market as well as the global market.The commodity is imported from the rest of the world to the U.S.market.
Figure 10-3 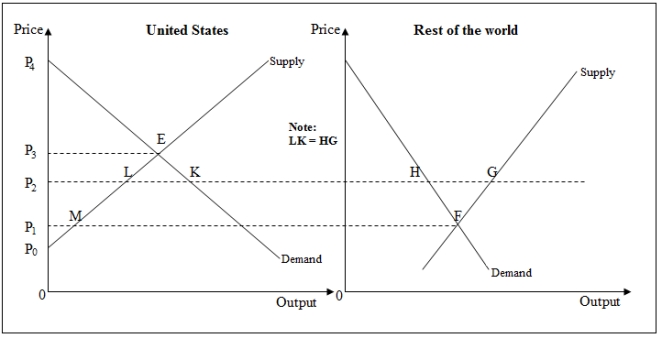
-In Figure 10-3,the total producer surplus after trade is _____.
A) P3ELP2
B) ELK
C) P2LP0
D) P2LMP1
Correct Answer:

Verified
Correct Answer:
Verified
Q17: In 2002,the U.S.imposed higher tariffs on steel
Q30: When the efficient rate of output is
Q38: Deregulation of the airline industry has resulted
Q46: The following figure shows the intersection of
Q48: The following figure shows the intersection of
Q49: The following figure shows the effect of
Q52: Which of the following correctly identifies the
Q53: The following figure shows the intersection of
Q54: The following figure shows the intersection of
Q55: The following figure shows the domestic U.S.market