Multiple Choice
The following figure shows the intersection of the demand and supply curves for a commodity in the domestic market at price P2 and quantity Q2,in the absence of trade.With trade,the supply curve shifts to Supplytrade.
Figure 10-4 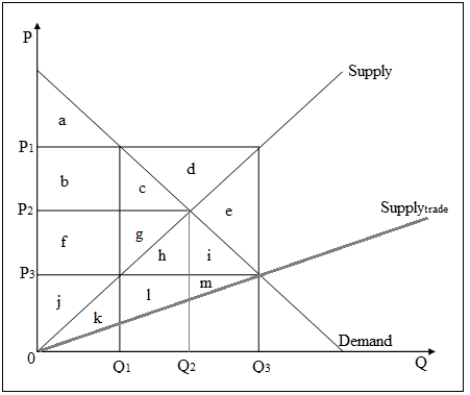
-Refer to Figure 10-4.The quantity of imports into the domestic market is given by _____.
A) Q2 - Q1
B) Q3 - Q2
C) Q3 - Q1
D) Q3
Correct Answer:

Verified
Correct Answer:
Verified
Q17: In 2002,the U.S.imposed higher tariffs on steel
Q28: A government study concludes that excessive alcohol
Q30: When the efficient rate of output is
Q37: The total surplus gained by all the
Q38: Deregulation of the airline industry has resulted
Q46: The following figure shows the intersection of
Q49: The following figure shows the effect of
Q50: The following figure shows the demand and
Q52: Which of the following correctly identifies the
Q53: The following figure shows the intersection of