Multiple Choice
FIGURE 8-20 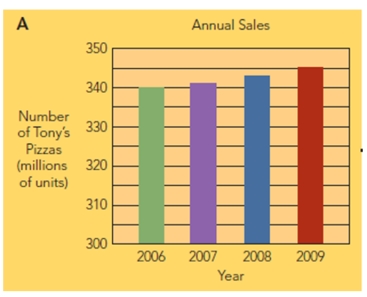
-Figure 8-20 above indicates that
A) annual sales of Tony's Pizzas are flat to slightly increasing over the period 2006-2009.
B) annual sales of Tony's pizzas are increasing significantly over the period 2006-2009.
C) children are eating more pizzas.
D) households with more members are eating more pizza, which drives this sales increase.
E) there was a greater change in growth between 2006 and 2007 than there was between 2008 and 2009.
Correct Answer:

Verified
Correct Answer:
Verified
Q222: Briefly explain what a product or brand
Q223: Field of Dreams and Million Dollar Baby
Q224: Marketing teams must be vigilant for ways
Q225: The 2007 _ contains data on the
Q226: A(n) _ question allows respondents to express
Q228: A(n) _ forecast involves starting with the
Q229: A _ is a sample of consumers
Q230: What is the marketing research term for
Q231: After defining the problem, the next step
Q232: FIGURE 8-20 <img src="https://d2lvgg3v3hfg70.cloudfront.net/TB4418/.jpg" alt="FIGURE 8-20