Essay
Students were asked to make a histogram of the number of corn snakes collected in Will County,Illinois from 1985 to 2006.They were given the data in the form of a stem-and-leaf display shown below: 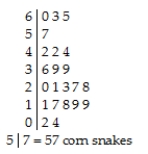
One student submitted the following display: 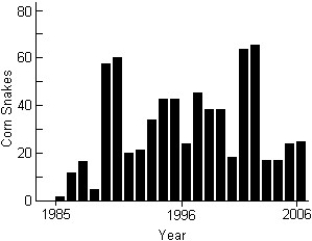
a)Comment on this graph.
b)Create your own histogram of the data.
Correct Answer:

Verified
a)This is not a histogram.The ...View Answer
Unlock this answer now
Get Access to more Verified Answers free of charge
Correct Answer:
Verified
View Answer
Unlock this answer now
Get Access to more Verified Answers free of charge
Q1: A small company employs a supervisor at
Q33: The histogram displays the body fat percentages
Q34: Which set has the largest standard deviation?
Q35: For class 2,compare the mean and the
Q36: Three statistics classes (50 students each)took the
Q39: The histograms show the cost of living,in
Q41: Jody got a bank statement each month
Q42: The back-to-back dotplot shows the number of
Q43: The stem-and-leaf diagram shows the ages of
Q138: A clerk entering salary data into a