Multiple Choice
The histograms show the cost of living,in dollars,for 32 U.S.cities.The histogram on the left shows the cost of living for the 32 cities using bins $10 wide,and the histogram on the right displays the same data using bins that are $6 wide.For which of the histograms would you most strenuously insist on using an IQR rather than a standard deviation to summarize spread? Explain. 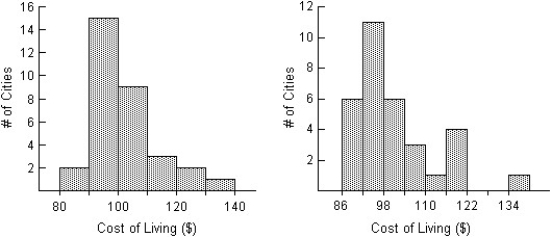
A) The histogram on the right is most nearly symmetric and shows no outliers.That makes it the best candidate for summarizing with an IQR.
B) The histogram on the left shows a low outlier.The standard deviation is sensitive to outliers,so we'd prefer to use the IQR for this one.
C) The histogram on the right shows a high outlier.The standard deviation is sensitive to outliers,so we'd prefer to use the IQR for this one.
D) The histogram on the left is most strongly skewed to the right.That makes it the best candidate for summarizing with an IQR.
E) The histogram on the left is most nearly symmetric and shows no outliers.That makes it the best candidate for summarizing with an IQR.
Correct Answer:

Verified
Correct Answer:
Verified
Q1: A small company employs a supervisor at
Q34: Which set has the largest standard deviation?
Q35: For class 2,compare the mean and the
Q36: Three statistics classes (50 students each)took the
Q38: Students were asked to make a histogram
Q41: Jody got a bank statement each month
Q42: The back-to-back dotplot shows the number of
Q43: The stem-and-leaf diagram shows the ages of
Q44: Three statistics classes (50 students each)took the
Q138: A clerk entering salary data into a