Multiple Choice
Three statistics classes (50 students each) took the same test.Shown below are histograms of the scores for the classes.Use the histograms to answer the question. 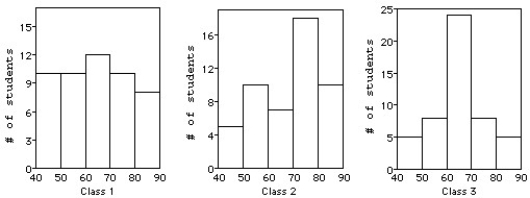
-For which class are the mean and median most different?
A) Class 2,because the shape is skewed to the right.
B) Class 1,because the shape is skewed to the left.
C) Class 2,because the shape is skewed to the left.
D) Class 2,because the shape is symmetric.
E) Class 3,because the shape is symmetric.
Correct Answer:

Verified
Correct Answer:
Verified
Q39: The histograms show the cost of living,in
Q41: Jody got a bank statement each month
Q42: The back-to-back dotplot shows the number of
Q43: The stem-and-leaf diagram shows the ages of
Q45: The stem-and-leaf display shows the results of
Q46: The employees at Frank's Furniture earned the
Q47: A weight-loss company used the following histogram
Q48: The precipitation,in millimetres,for August is given for
Q49: The diastolic blood pressures,in mm Hg,for a
Q138: A clerk entering salary data into a