Multiple Choice
The stem-and-leaf diagram shows the ages of 17 people at a playground in London,Ontario. 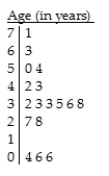
Key:
3 | 3 = 33 years
A) The distribution of the ages of people at the playground is skewed to the left,with a typical age between 32 and 38.With the exception of the 3 people less than 10 years old,the ages are between 27 and the maximum 71 .
B) The distribution of the ages of people at the playground is skewed to the right,with a typical age between 42 and 54.With the exception of the 3 people less than 10 years old,the ages are between 27 and the maximum 71.
C) The distribution of the ages of people at the playground is skewed to the right,with a typical age between 27 and 71 .There are 3 outliers,when people are less than 10 years old.
D) The distribution of the ages of people at the playground is skewed to the right,with a typical age between 32 and 38 .
E) The distribution of the ages of people at the playground is skewed to the right,with a typical age between 32 and 38.With the exception of the 3 people less than 10 years old,the ages are between 27 and the maximum 71.
Correct Answer:

Verified
Correct Answer:
Verified
Q38: Students were asked to make a histogram
Q39: The histograms show the cost of living,in
Q41: Jody got a bank statement each month
Q42: The back-to-back dotplot shows the number of
Q44: Three statistics classes (50 students each)took the
Q45: The stem-and-leaf display shows the results of
Q46: The employees at Frank's Furniture earned the
Q47: A weight-loss company used the following histogram
Q48: The precipitation,in millimetres,for August is given for
Q138: A clerk entering salary data into a