Multiple Choice
The back-to-back dotplot shows the number of fatalities per year caused by tornadoes in a certain state for two periods: 1950-1974 and 1975-1999.Explain how you would summarize the centre and spread of each of the variables depicted in the dotplots. 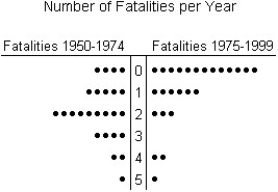
A) The distribution of the number of fatalities per year for the period 1950-1974 is unimodal and approximately symmetric.Therefore,we would be satified using the mean to summarize the centre and the standard deviation to summarize spread.For the period 1975-1999,the distribution of the number of fatalities per year is also unimodal,but skewed to the right.Therefore,we would prefer to use a median for centre and an IQR to summarize spread.
B) The distribution of the number of fatalities per year for the period 1950-1974 is unimodal,but skewed to the right.Therefore,we would prefer to use a median for centre and an IQR to summarize spread.For the period 1975-1999,the distribution is also unimodal and approximately symmetric.Therefore,we would be satisfied using the mean to summarize the centre and the standard deviation to summarize spread.
C) The distribution of the number of fatalities per year for the period 1950-1974 is bimodal.Therefore,we would prefer to use a median to summarize the centre and an IQR to summarize spread.For the period 1975-1999,the distribution of the number of fatalities per year is also bimodal,but skewed to the left.Therefore,we would prefer to use a mean for centre and an standard deviation to summarize spread.
D) The distribution of the number of fatalities per year for the period 1950-1974 is unimodal and approximately symmetric.Therefore,we would prefer to use the median to summarize the centre and the standard deviation to summarize spread.For the period 1975-1999,the distribution of the number of fatalities per year is also unimodal,but skewed to the right.Therefore,we would prefer to use the mean for centre and an IQR to summarize spread.
E) The distribution of the number of fatalities per year for the period 1950-1974 is unimodal but skewed to the right.Therefore,we would prefer to use a median to summarize the centre and and IQR to summarize spread.For the period 1975-1999,the distribution of the number of fatalities per year is also unimodal and skewed to the right.Therefore,we would prefer to use a median for centre and an IQR to summarize spread.
Correct Answer:

Verified
Correct Answer:
Verified
Q1: A small company employs a supervisor at
Q38: Students were asked to make a histogram
Q39: The histograms show the cost of living,in
Q41: Jody got a bank statement each month
Q43: The stem-and-leaf diagram shows the ages of
Q44: Three statistics classes (50 students each)took the
Q45: The stem-and-leaf display shows the results of
Q46: The employees at Frank's Furniture earned the
Q47: A weight-loss company used the following histogram
Q138: A clerk entering salary data into a