Multiple Choice
Shown below are the boxplot and the histogram for the weekly salaries (in dollars) of 24 randomly selected employees of a company: 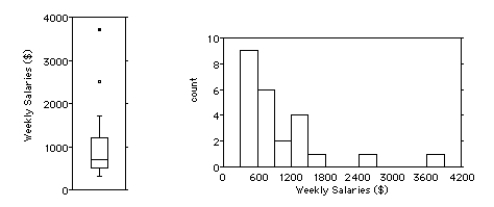
i.What features of the distribution can you see in both the histogram and the boxplot?
ii.What features of the distribution can you see in the boxplot that you could not see in the histogram?
A) i) The distribution is unimodal and skewed to the right,with two outliers at $2500 and about $3700.The mean is greater than the median because of the skewedness.
ii.You can more easily tell from the boxplot that the median is about $700 with quartiles at about $500 and $1200.
B) i) The distribution is symmetrical,with two outliers at $2900 and about $3000.The mean and median are about the same.
ii.You can more easily tell from the boxplot that the mean is about $500 with quartiles at about $700 and $1800.
C) i) The distribution is unimodal and skewed to the left,with two outliers at $2500 and about $3700.The mean is lower than the median because of the skewedness.
ii.You can more easily tell from the boxplot that the median is about $900 with quartiles at about $1100 and $1600.
D) i) The distribution is unimodal and skewed to the right,with two outliers at $2900 and about $3000.The mean is greater than the median because of the skewedness.
ii.You can more easily tell from the boxplot that the median is about $700 with quartiles at about $500 and $1200.
E) i) The distribution is symmetrical,with two outliers at $2500 and about $3700.The mean and median are about the same.
ii.You can more easily tell from the boxplot that the mean is about $700 with quartiles at about $500 and $1200.
Correct Answer:

Verified
Correct Answer:
Verified
Q26: Here are the highest temperatures ever recorded
Q27: The test scores of 15 students are
Q28: The weekly salaries (in dollars)of 24 randomly
Q29: Use the high closing values of Naristar
Q30: Shown below are the boxplot,the histogram and
Q32: Here are summary statistics for the time,in
Q33: The normal monthly precipitation (in inches)for August
Q34: Here are 3 boxplots of weekly gas
Q35: Here are boxplots of the points scored
Q36: The weekly salaries (in dollars)of 24 randomly