Essay
Use the high closing values of Naristar Inc.stock from the years 1990 - 2001 to construct a timeplot. 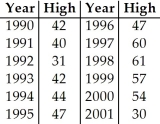
Correct Answer:

Verified
Correct Answer:
Verified
Related Questions
Q24: The weekly salaries (in dollars)of 24 randomly
Q25: The weekly salaries (in dollars)of sixteen government
Q26: Here are the highest temperatures ever recorded
Q27: The test scores of 15 students are
Q28: The weekly salaries (in dollars)of 24 randomly
Q30: Shown below are the boxplot,the histogram and
Q31: Shown below are the boxplot and the
Q32: Here are summary statistics for the time,in
Q33: The normal monthly precipitation (in inches)for August
Q34: Here are 3 boxplots of weekly gas