Multiple Choice
The back-to-back stem-and-leaf display compares the percent growth in sales for a retail chain's stores located in two regions of Canada.The lower stem contains leaves with the digits 0-4 and the upper stem contains leaves with digits 5-9. 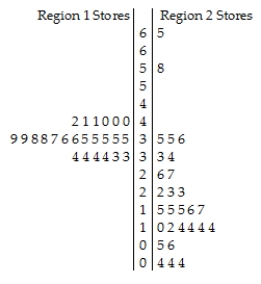
Key:
3 | 5 = 35% sales growth
A) The distribution of sales growth in Region 1 stores is unimodal,symmetric and tightly clustered around 35% growth.The distribution of sales growth in Region 2 stores is much more spread out,with most stores having sales growth between 5% and 35%.A typical Region 2 store had about 15% growth.There were two outliers,one store with 58% growth and another with 65% growth.Generally,the sales growth rates in the Region 2 stores were higher and more variable than the rates in the Region 1 stores.
B) The distribution of sales growth in the Region 1 stores is unimodal,symmetric and tightly clustered around 35% growth.The distribution of sales growth in Region 2 stores is much more spread out,with most stores having sales growth between 5% and 35%.A typical Region 2 store had about 15% growth.There were two outliers,one store with 58% growth and another with 65% growth.Generally,the sales growth rates in the Region 1 stores were higher and less variable than the rates in the Region 2 stores.
C) The distribution of sales growth in Region 1 stores is unimodal,symmetric and tightly clustered around 35% growth.The distribution of sales growth in Region 2 stores is much more spread out,with most stores having sales growth between 5% and 35%.A typical Region 2 store had about 15% growth.There were two outliers,one store with 58% growth and another with 65% growth.Generally,the sales growth rates in the Region 1 stores were higher and more variable than the rates in the Region 2 stores.
D) The distribution of sales growth in Region 1 stores is unimodal,symmetric and tightly clustered around 45% growth.The distribution of sales growth in Region 2 stores is much more spread out,with most stores having sales growth between 5% and 35%.A typical Region 2 store had about 25% growth.There were two outliers,one store with 58% growth and another with 65% growth.Generally,the sales growth rates in the Region 2 stores were higher and more variable than the rates in the Region 1 stores.
E) The distribution of sales growth in Region 1 stores is unimodal,symmetric and tightly clustered around 45% growth.The distribution of sales growth in Region 2 stores is much more spread out,with most stores having sales growth between 5% and 35%.A typical Region 2 store had about 25% growth.There were two outliers,one store with 58% growth and another with 65% growth.Generally,the sales growth rates in the Region 1 stores were higher and less variable than the rates in the Region 2 stores.
Correct Answer:

Verified
Correct Answer:
Verified
Q7: Here is a histogram of the assets
Q8: Shown below are the histogram and summary
Q9: The histograms show the cost of living,in
Q10: Here are the summary statistics for the
Q11: Office workers were asked how long it
Q13: Here are summary statistics of the last
Q14: The boxplots display case prices (in dollars)of
Q15: Shown below are the boxplot,the histogram and
Q17: Here are summary statistics for the time,in
Q96: The speed vehicles travelled on a local