Multiple Choice
Office workers were asked how long it took them,in minutes,to travel to work one morning.Here is the stem-and-leaf display. 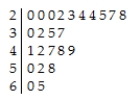
Would you use the median or the mean to describe the centre of this distribution?
A) Mean,because the data are skewed to the right.
B) Mean,because the data are skewed to the left.
C) Mean,because the data are symmetric.
D) Median,because the data are skewed to the right.
E) Median,because the data are skewed to the left.
Correct Answer:

Verified
Correct Answer:
Verified
Q7: Here is a histogram of the assets
Q8: Shown below are the histogram and summary
Q9: The histograms show the cost of living,in
Q10: Here are the summary statistics for the
Q12: The back-to-back stem-and-leaf display compares the percent
Q13: Here are summary statistics of the last
Q14: The boxplots display case prices (in dollars)of
Q15: Shown below are the boxplot,the histogram and
Q24: For which class are the mean and
Q96: The speed vehicles travelled on a local