Multiple Choice
The scatterplot below displays the total home attendance (in millions) for major league baseball's National League for the years 1960 through 2002.This total home attendance is the grand total of all attendees at all National League games during the season.For what range of years is a linear model appropriate? 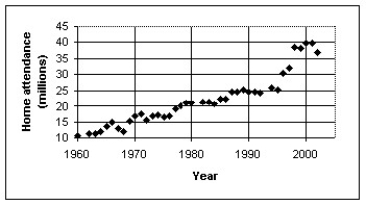
A) A linear model should not be used for any part of the data set.
B) A single linear model is appropriate for the entire data set.
C) One linear model for 1960 through 1995 and another linear model for 1995 through 2002.
D) A linear model should be used for each pair of adjacent data points.
E) None of these
Correct Answer:

Verified
Correct Answer:
Verified
Q22: The figure below shows the life expectancy
Q23: ,The total home-game attendance for major-league baseball
Q24: Which of the labeled points below are
Q25: Which of the labeled points below will
Q27: A university studied students' grades and established
Q28: Which of the following scatterplots of residuals
Q29: Which of the labeled points below are
Q30: The scatterplot below displays world population (in
Q31: The figure below shows the recent trend
Q32: Which of the labeled points below will