Multiple Choice
The figure below shows the life expectancy for persons living in the U.S.A. 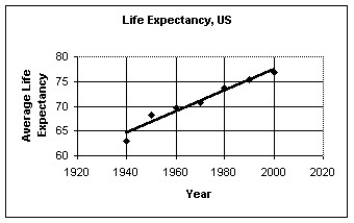
The regression analysis of the data yields the following values: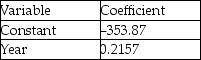
R2 = 0.9539
Use the regression model to predict the life expectancy in 2015.
A) 81 years
B) 79 years
C) 84 years
D) 83 years
E) 80 years
Correct Answer:

Verified
Correct Answer:
Verified
Q17: The scatterplot below displays the average longevity
Q18: The scatterplot below displays the yearly production
Q19: The figure below shows the association between
Q20: Which of the labeled points below are
Q21: The table below displays the latitude (degrees
Q23: ,The total home-game attendance for major-league baseball
Q24: Which of the labeled points below are
Q25: Which of the labeled points below will
Q27: A university studied students' grades and established
Q27: The scatterplot below displays the total home