Multiple Choice
The figure below shows the recent trend in first-birth rate for women in the U.S.A.between the ages of 18 and 19.(The first-birth rate is the number of 18 to 19 year-olds per 1000 who give birth to their first child) . 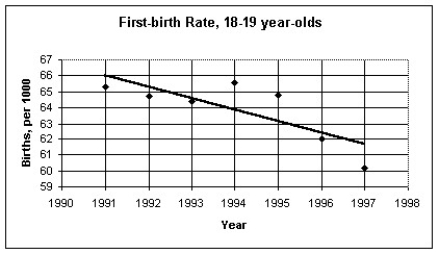
The regression analysis of this data yields the following values: 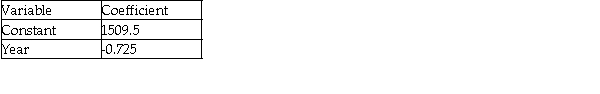
R2 = 0.6174
Use this model to predict the first-birth rate for 18 to 19 year-olds in 2006.
A) 58 per 1000
B) 55 per 1000
C) 51 per 1000
D) 61 per 1000
E) 53 per 1000
Correct Answer:

Verified
Correct Answer:
Verified
Q22: The figure below shows the life expectancy
Q23: ,The total home-game attendance for major-league baseball
Q24: Which of the labeled points below are
Q25: Which of the labeled points below will
Q27: The scatterplot below displays the total home
Q27: A university studied students' grades and established
Q28: Which of the following scatterplots of residuals
Q29: Which of the labeled points below are
Q30: The scatterplot below displays world population (in
Q32: Which of the labeled points below will