Multiple Choice
The scatterplot below displays world population (in millions) for the years 0 - 1800.Where the population is an estimate,the lower estimate is given.For what range of years is a linear model appropriate? 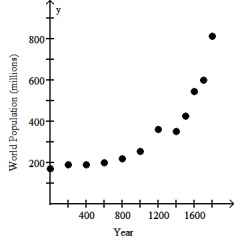
A) One linear model is appropriate for the years 0 through 1000 and another linear model for the years 1400 through 1800.
B) A single linear model is appropriate for the entire data set.
C) One linear model is appropriate for the years 0 through 600 and another linear model for the years 600 through 1800.
D) A linear model should be used for each pair of adjacent data points.
E) A linear model should not be used for any part of the data.
Correct Answer:

Verified
Correct Answer:
Verified
Q22: The figure below shows the life expectancy
Q23: ,The total home-game attendance for major-league baseball
Q24: Which of the labeled points below are
Q25: Which of the labeled points below will
Q27: The scatterplot below displays the total home
Q27: A university studied students' grades and established
Q28: Which of the following scatterplots of residuals
Q29: Which of the labeled points below are
Q31: The figure below shows the recent trend
Q32: Which of the labeled points below will