Multiple Choice
The scatterplot below displays the yearly production in millions of pounds of flue-cured tobacco in the U.S.For what range of years is a linear model appropriate? 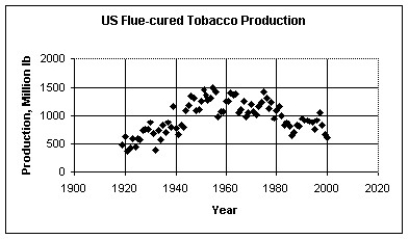
A) A linear model should be used for each pair of adjacent data points.
B) A single linear model is appropriate for the entire data set.
C) One linear model for 1919 through about 1960 and another linear model for about 1960 through 2000.
D) A linear model should not be used for any part of the data.
E) None of these
Correct Answer:

Verified
Correct Answer:
Verified
Q13: The table below shows the age and
Q14: The figure below examines the association between
Q15: The figure below shows the association between
Q16: A reporter studied the causes of a
Q17: The scatterplot below displays the average longevity
Q19: The figure below shows the association between
Q20: Which of the labeled points below are
Q21: The table below displays the latitude (degrees
Q22: The figure below shows the life expectancy
Q23: ,The total home-game attendance for major-league baseball