Multiple Choice
The table below displays the latitude (degrees north) and average daily minimum temperature in January (in degrees Fahrenheit) for some cities located in the northern hemisphere. 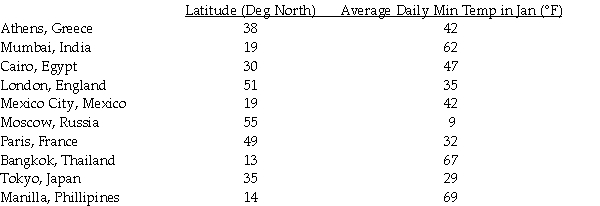
The scatter plot and regression equation are shown below: 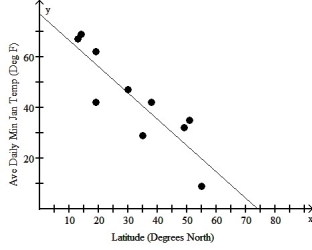
The regression analysis of this data yields the following values: 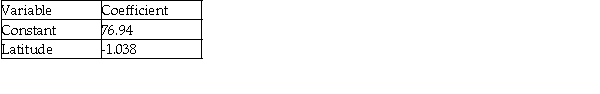
R2 = 0.7660
Use this model to predict the average daily minimum temperature in January for Panama City whose latitude is 9 degrees north.
A) 9.3° F
B) 67.6° F
C) 86.3° F
D) 61.5° F
E) 54.0° F
Correct Answer:

Verified
Correct Answer:
Verified
Q16: A reporter studied the causes of a
Q17: The scatterplot below displays the average longevity
Q18: The scatterplot below displays the yearly production
Q19: The figure below shows the association between
Q20: Which of the labeled points below are
Q22: The figure below shows the life expectancy
Q23: ,The total home-game attendance for major-league baseball
Q24: Which of the labeled points below are
Q25: Which of the labeled points below will
Q27: A university studied students' grades and established