Multiple Choice
The figure below shows the association between female life expectancy and the average number of children women give birth to for several different countries.Also shown is the equation and correlation from a regression analysis.What is the correct conclusion to draw from the figure? 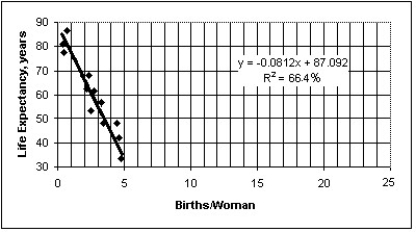
A) While there appears to be a very strong association,there is probably not a cause-and-effect relationship between female life expectancy and the average number of children women give birth to .Access to basic health care is probably a lurking variable that drives both female life expectancy and the average number of children women give birth to.
B) Those countries with low life expectancies clearly have no regard for children or expectant mothers.
C) Countries that have low life expectancies and high average number of children women give birth to seem to have less regard for the sanctity of human life.
D) The association must be coincidental.I would expect the association to have a positive slope,not the negative one illustrated above.
E) High average number of children women give birth to is causing reduced life expectancy,probably because of the increased fatigue and emotional stress exerted on mothers.
Correct Answer:

Verified
Correct Answer:
Verified
Q14: The figure below examines the association between
Q15: The figure below shows the association between
Q16: A reporter studied the causes of a
Q17: The scatterplot below displays the average longevity
Q18: The scatterplot below displays the yearly production
Q20: Which of the labeled points below are
Q21: The table below displays the latitude (degrees
Q22: The figure below shows the life expectancy
Q23: ,The total home-game attendance for major-league baseball
Q24: Which of the labeled points below are