Multiple Choice
The scatterplot below shows the percentage of the US population that is foreign born for the years 1910 - 1990.For what range of years is a linear model appropriate? 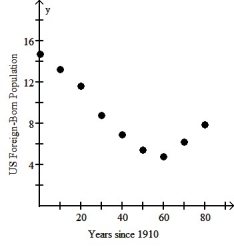
A) One linear model is appropriate for the years 1910 through 1950 and another linear model for the years 1950 through 1990.
B) A linear model should be used for each pair of adjacent data points.
C) One linear model is appropriate for the years 1910 through 1970 and another linear model for the years 1970 through 1990.
D) A linear model should not be used for any part of the data.
E) A single linear model is appropriate for the entire data set.
Correct Answer:

Verified
Correct Answer:
Verified
Q5: The table below shows the gestation (in
Q6: A study finds a strong positive association
Q7: The data in the table below can
Q8: Which of the following scatterplots of residuals
Q9: Over a period of years,a certain town
Q11: A study of consumer behavior finds a
Q12: Which of the labeled points below are
Q13: The table below shows the age and
Q14: The figure below examines the association between
Q15: The figure below shows the association between