Multiple Choice
The table below shows the gestation (in days) and average longevity (in years) for a number of different mammals: 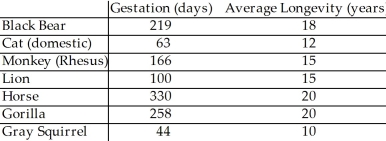
The scatter plot and regression equation are shown below: 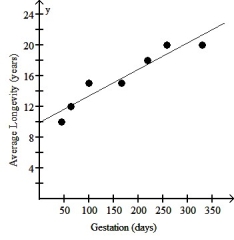
The regression analysis of this data yields the following values: 
R2 = 0.9048
Use this model to predict the average longevity of an African elephant whose gestation is 660 days.
A) 32.7 years
B) 38.7 years
C) 41.9 years
D) 22.8 years
E) 51.2 years
Correct Answer:

Verified
Correct Answer:
Verified
Q1: An economist noticed that nations with more
Q2: Which of the following scatterplots of residuals
Q3: A college admissions officer in the U.S.A.
Q4: Which of the following scatterplots of residuals
Q6: A study finds a strong positive association
Q7: The data in the table below can
Q8: Which of the following scatterplots of residuals
Q9: Over a period of years,a certain town
Q10: The scatterplot below shows the percentage of
Q11: A study of consumer behavior finds a