Multiple Choice
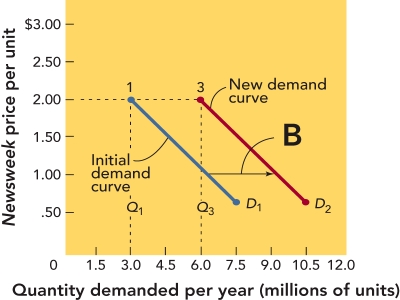 Figure 13-5B
-Figure 13-5B above shows that when the quantity demanded moves from 3.0 to 6.0 million units along the demand curve D1,the profit
A) increases from $1.50 to $2.00 per unit.
B) decreases from $2.00 to $1.50 per unit.
C) stays the same per unit.
D) increases from $0.50 to $1.50 per unit.
E) Figure 13-5B does not indicate what happens to profit when the quantity demanded moves.
Correct Answer:

Verified
Correct Answer:
Verified
Q48: Economists have identified four types of competitive
Q52: Explain why price elasticity is important to
Q54: Making special adjustments to the list or
Q67: of the following are demand factors EXCEPT:<br>A)
Q69: use of "special fees" and "surcharges" is
Q71: practice of simultaneously increasing product and service
Q73: of the following statements about price are
Q75: ratio of perceived benefits to price is
Q77: over half of tickets to major events
Q187: According to the price equation,a product's or