Multiple Choice
The figure below shows the short-run aggregate supply of an economy.Which of the following is likely to be true if the actual price level in this figure exceeds the expected price level?
Figure 10.1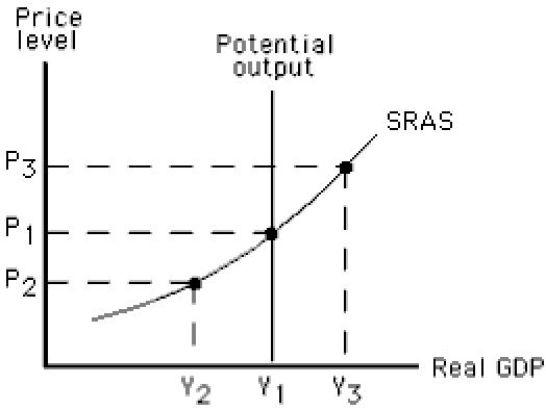
A) Equilibrium output will be Y2 in the short run.
B) Equilibrium output will be Y1 in the short run.
C) The actual unemployment rate is below the natural rate.
D) Potential output is greater than actual output.
E) The actual price level is less than the equilibrium price level.
Correct Answer:

Verified
Correct Answer:
Verified
Q1: Which of the following is true of
Q12: Which of the following explains the shape
Q13: The figure below shows short-run equilibrium in
Q14: The figure below shows the determination of
Q15: The figure below shows equilibrium in an
Q18: The figure below shows short-run equilibrium in
Q21: For the aggregate demand and aggregate supply
Q57: If the price level increases by 5
Q105: The rate at which aggregate supply changes
Q117: Suppose the actual and expected price levels