Multiple Choice
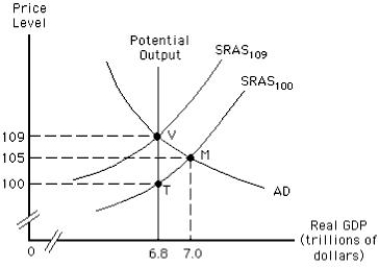
The figure below shows equilibrium in an aggregate demand-aggregate supply model.Which of the following will be true of an economy in the long run that is at point M in the short run?
Figure 10.4
A) The actual price level will be lower than the expected price level.
B) The actual output will fall short of the potential output.
C) The short-run aggregate supply curve will remain stable at SRAS100.
D) The short-run aggregate supply curve will shift to SRAS109.
E) Real GDP will be equal to nominal GDP.
Correct Answer:

Verified
Correct Answer:
Verified
Q1: Which of the following is true of
Q12: Which of the following explains the shape
Q13: The figure below shows short-run equilibrium in
Q14: The figure below shows the determination of
Q16: The figure below shows the short-run aggregate
Q18: The figure below shows short-run equilibrium in
Q57: If the price level increases by 5
Q105: The rate at which aggregate supply changes
Q117: Suppose the actual and expected price levels
Q124: Which of the following is true in