Multiple Choice
The figure below shows short-run equilibrium in an aggregate demand-aggregate supply model.In this figure,the distance between points Y1 and Y2 represents:
Figure 10.5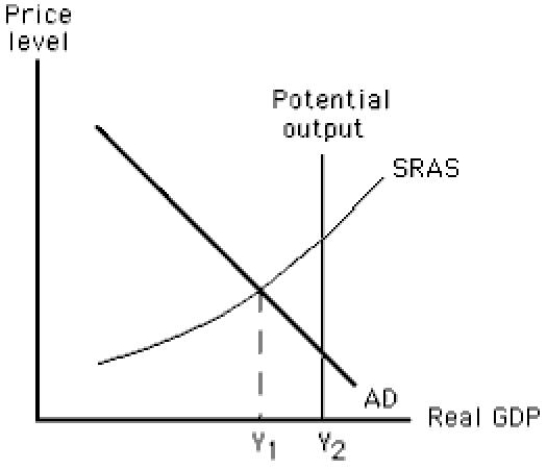
A) an expansionary gap.
B) a recessionary gap.
C) the potential output.
D) seasonal unemployment.
E) structural unemployment.
Correct Answer:

Verified
Correct Answer:
Verified
Q1: Which of the following is true of
Q13: The figure below shows short-run equilibrium in
Q14: The figure below shows the determination of
Q15: The figure below shows equilibrium in an
Q16: The figure below shows the short-run aggregate
Q21: For the aggregate demand and aggregate supply
Q76: The main effect of a decrease in
Q105: The rate at which aggregate supply changes
Q117: Suppose the actual and expected price levels
Q145: The main effect of an increase in