Multiple Choice
The figure below shows the determination of the equilibrium price level and real GDP in an aggregate demand-aggregate supply model.The movement shown in this figure is most likely to be caused by:
Figure 10.6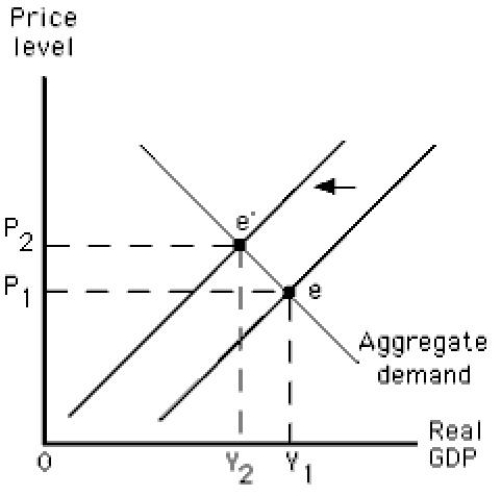
A) a decrease in the real wage.
B) an increase in the economy's capital stock.
C) the actions of a labor union.
D) a decrease in consumer spending.
E) an increase in labor productivity.
Correct Answer:

Verified
Correct Answer:
Verified
Q12: Which of the following explains the shape
Q13: The figure below shows short-run equilibrium in
Q15: The figure below shows equilibrium in an
Q16: The figure below shows the short-run aggregate
Q18: The figure below shows short-run equilibrium in
Q57: If the price level increases by 5
Q93: Which of these is most likely to
Q105: The rate at which aggregate supply changes
Q117: Suppose the actual and expected price levels
Q124: Which of the following is true in